Intro
Continuing on from where we left off in part 1 and part 2, this blog post will concentrate on preventing and diagnosing bugs and investigating crashes in your native apps, developed with the Xcode. After all, if you take aside some of its deficiencies in the UI, Xcode has quite a nice toolset for dealing with bugs.
For most of the demonstrations in this blog post I will be using my GitHub Xcode project from part 2, and another project called CrashMe.
Contents
This post needs its own table of contents as well:
- Build Schemes in Xcode
- How to Configure Build Schemes
- How to Diagnose Memory Corruption
- Example of Address Sanitizer in Xcode
- More On Sanitizers in Xcode
- How To Debug Early Process Initialization (eg. Launch Daemons)
- How To Debug Post-Mortem Crashes Using Crash Log Files
- How To Symbolicate a Crash Log File
Build Schemes in Xcode
The first step of utilizing the power of debugging tools in Xcode is to understand its build schemes. For those who are familiar with the Visual Studio, build schemes work slightly different than the build configuration in Visual Studio. But the concept is fairly similar.
There are two main build configurations, if you will:
- Debug - is used when developing and debugging your project. This is the build configuration that should be used the most during the development stage of your app. The binary code that it produces after compilation is unoptimized, with special debugging features built into it. This is what should help you find most of the bugs during the development stage.
- Release - is used to build the final product that you will deliver to your customers. This is a fully optimized build, with all debugging features disabled, that is streamlined for production.
The concept of Debug and Release configurations is basically the same for the Visual Studio and the Xcode. What is different is how it is configured.
In Visual Studio (for native code) the project comes preconfigured with the Debug and Release build configurations. Each one consists of individual compiler and linker settings. After that a user can change existing build configurations or create new ones.
In Xocde, the setup is slightly different. It introduces a concept of build schemes. They are similar to build configurations in Visual Studio, except that they act as a higher level concept. Besides just specifying Debug or Release build configuration, they also provide additional build settings and tooling.
Then the "Build Settings" page in the Xcode project setting has different options that may apply to Debug and Release configurations. For instance, take a look at the "Enable Foundation Assertions" or "Preprocessor Macros" settings:

Notice that they both have different options for Debug and Release configurations. That is how Xcode lets you distinguish different build settings for those two configuration.
Note that not all build settings in Xcode allow to specify different settings for each build configuration.
Then before building the project in Xcode you first select the scheme that you want to use in the drop-down menu on top:

During the build, Xcode will use selected build scheme with its settings and debugging tooling.
How to Configure Build Schemes
When you create a native app project in Xcode it comes with just a single build scheme, and it is mighty inconvenient to change settings in it for every type of compilation.
Thus I would strongly recommend to create at least two (or more) build schemes to facilitate with your build process.
As I described above, at least two build configurations are advisable: Debug and Release. But you may obviously extend it if you like.
The thinking goes, that you will use a debugging build scheme most of the time during your development phase. And only when you are ready to ship the test build of your product to beta testers, or to your clients, you will use the release (or production) build scheme.
Here's how I would usually configure my new project in Xcode before I start adding code to it:
- Click on the project name on top of the Xcode window and select "Edit Scheme":

You can also do the same by going to
Product->Scheme->Edit Schemein the Xcode menu. - You will see the build configuration window:

By default, it will have the "Run" tab selected for your single build scheme. Its name will be displayed on top. In my case it was "macOS tips - part 2". As you can see the default build scheme is set up for the "Debug" build configuration.
- Lets duplicate it by clicking the "Duplicate Scheme" button. Then add " - Release" to the scheme name and remove the word "Copy of" that the Xcode adds to its name automatically:

This will allow you to distinguish between your build schemes. This one will obviously be for release, or production builds.
- Then let's rename the original build scheme. For that go to
Product->Scheme->Manage Schemesin the Xcode menu to open this window:
And slow click twice on the first build scheme, to let Xcode rename it for you.
This is one of the dumb Xcode UI options where I couldn't find any other way to rename the scheme. In this case you have to click the scheme name once and then click it again after about a second.
In this case let's rename this scheme to "macOS tips - part 2 - Debug".
And while at it, also put a checkmark in the "Shared" column for all schemes:

"Shared" build scheme is another quite quirky setting in Xcode. If the scheme is shared, it can be copied to another computer if you copy-paste the folder where the Xcode project is stored. Otherwise if the "Shared" checkbox is not checked, that scheme will not be copied.
It really beats me why someone would not want to have that option checked though?
- Now when you click on the scheme name on top of the Xcode window you should be able to select among your two new build schemes:

This is also a shortcut to edit a build scheme, if you need to.
- Then let's edit each scheme to fit their names. Because at this point the two build schemes that've created have identical settings.
- Let's start from the Debug scheme. Open it for editing, and click the "Run" tab:

Make sure that "Build configuration" is set to Debug, and "Debug executable" is checked.
By the way, this is also where you can set up the Xcode to run your built binary as a root user during debugging, or when you go to
Product->Runin the Xcode menu.To do that select "root" in the "Debug Process As" option for your build scheme.
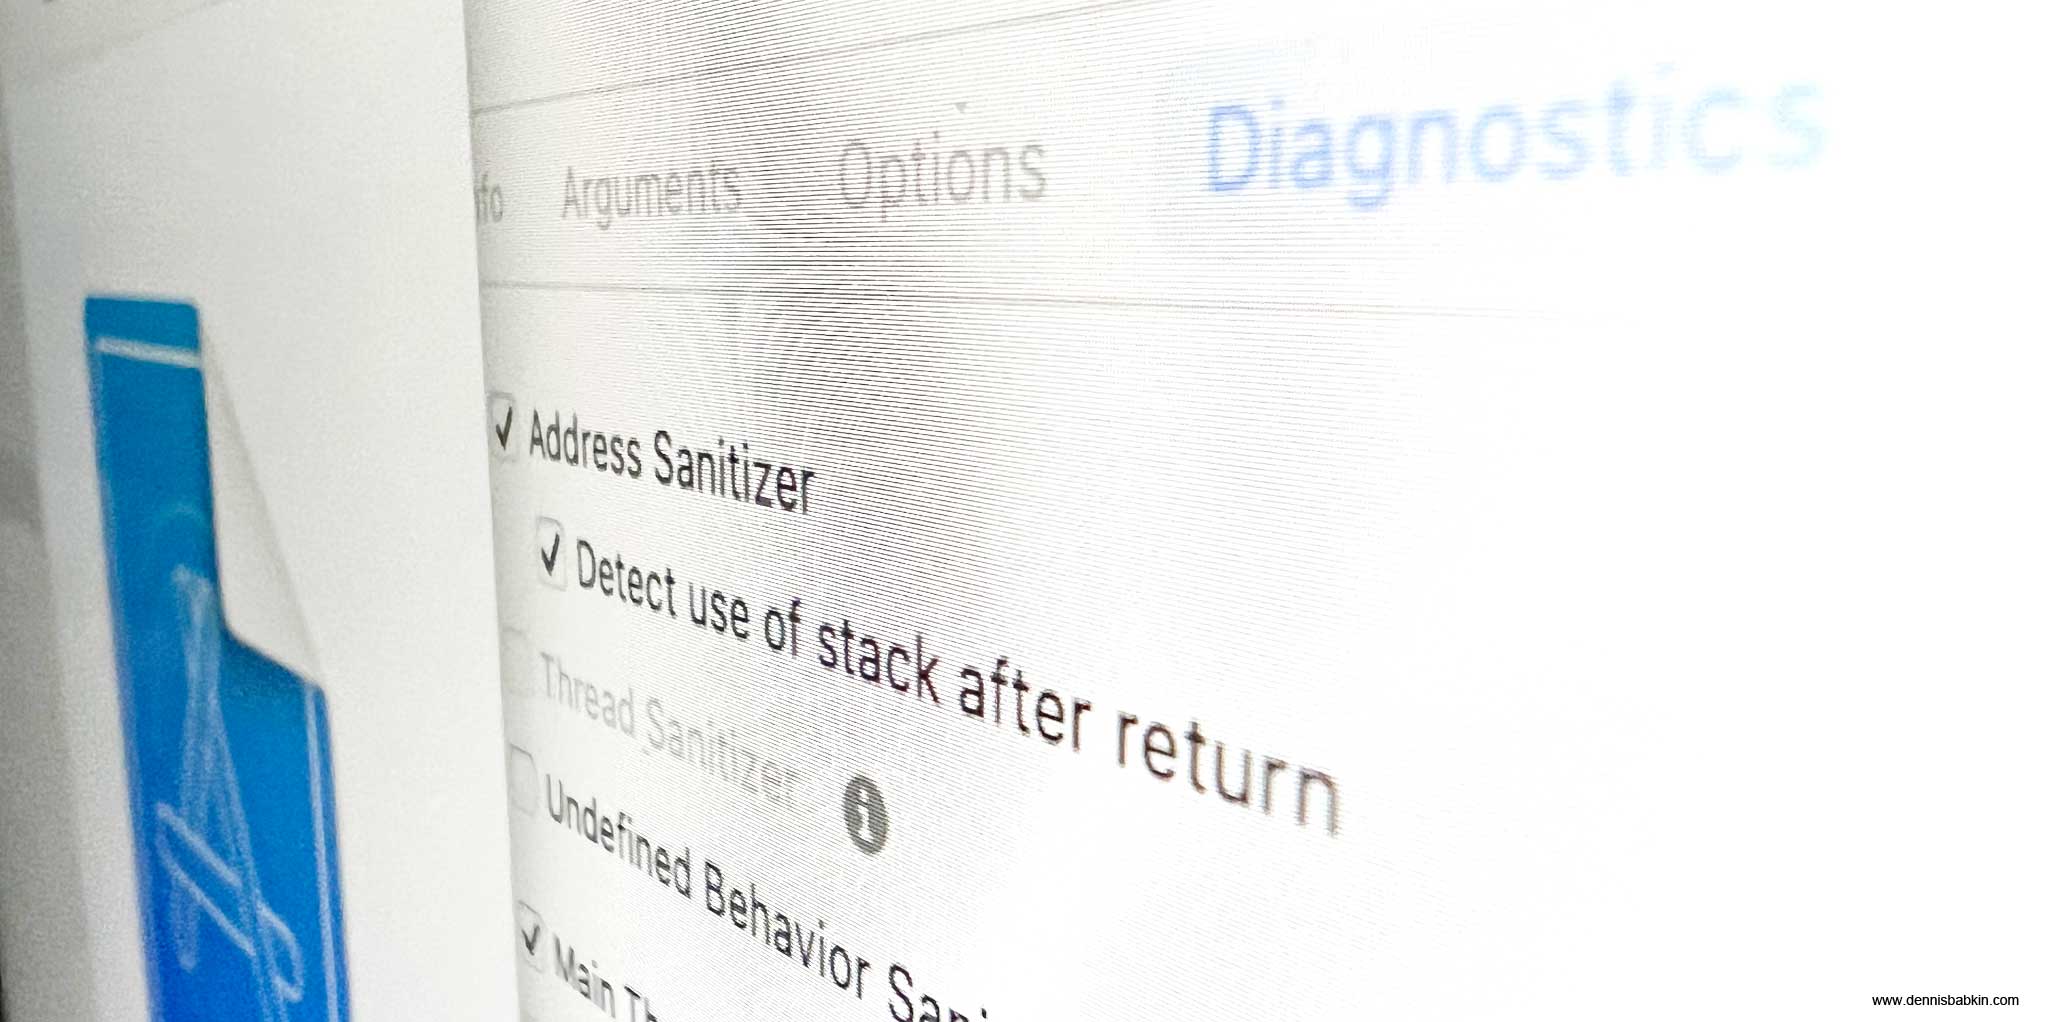
- Then switch the "Diagnostics" pane on top and check all appropriate options for your project:

I will explain the diagnostics tooling in detail later.
- Then switch to the Release build scheme:

And choose to edit it.
- In the "Info" pane for the "Run" tab, make sure to select "Release" in the "Build configuration":

You may still keep the "Debug executable" option checked if you need to debug a production binary. Note that it won't be as easy to step through it with a debugger as it was with an unoptimized Debug build.
- Then switch to the "Diagnostics" pane on top and uncheck all diagnostic options:

It is important to do this with most of these diagnostic options as they add an extra overhead to your compiled binaries that you do not want in your production builds.
- Now your build schemes are ready. Make sure to select your Debug scheme when you are developing your project:

I would not recommend changing default build settings from what they are set in Xcode, unless you are absolutely sure in their function. As far as I know, there doesn't seem to be any way to reset them to defaults in your project if you mess something up.
Note that the build schemes that you created in Xcode will be also available for automated builds using the xcodebuild command line tool. I will describe it in one of my future blog posts.
Now on, as I said above, use your Debug build scheme for when you are developing your app (or most of the time), and the Release scheme when you need to make a production build for your clients or beta-testers.
How to Diagnose Memory Corruption
Now that I explained how to set up build schemes in Xcode, let's review a situation when you may be faced with one of the most nefarious bugs that you can come across in your native application.
Newer type-safe languages like Rust may not be subject to this type of bugs.
While developing one of my projects in Xcode, I faced a crash in my launch daemon that would manifest itself only during some sequence of events. The component that crashed had seemingly nothing to do with the crash itself, and the call-stack had no helpful information to indicate a culprit. Moreover, the crashing component would shift from one to another, which looked like it depended on the day of the week, or the color of socks I was wearing that day. All this was driving me nuts for days.
The symptoms above were telltale signs of a memory corruption bug. Or, when one piece of code accidentally overwrites someone else's memory, resulting in a later crash in that other component.
To illustrate this, Let's review the following code sample written in C++. Before reading further down, can you spot an issue in it?
#define SIZEOF(f) (sizeof(f) / sizeof(f[0]))	//Helper preprocessor definition to get the number of elements in C array

char* pBuff = nullptr;
int nchLnBuff = 0;
size_t szcbLnStr = 0;

static const char pStrSuffix[] = "\n";

for(;;)
{
	//Format the result
	//INFO: Returns:
	//      The number of characters that would have been written if buffer had been
	//      sufficiently large, not counting the terminating null character.
	//      If an encoding error occurs, a negative number is returned.
	nchLnBuff = snprintf(pBuff, nchLnBuff,
							 "%s%04u-%02u-%02u %02u:%02u:%02u.%06u {%s|%s|%s%s} [%u:%llu] %s%s%s%s"
							 ,
							 pTypeStr,				//null-terminated C-string

							 1900 + dtm.tm_year,	//dtm = type struct tm
							 1 + dtm.tm_mon,
							 dtm.tm_mday,
							 dtm.tm_hour,
							 dtm.tm_min,
							 dtm.tm_sec,
							 tv.tv_usec,			//tv = type timeval

#ifdef LAUNCH_DAEMON
							 ":"
#else
							 "a"
#endif
							 ,
							 APP_VERSION,   //null-terminated C-string
							 pBitness,      //null-terminated C-string
							 pDbgConfig,    //null-terminated C-string

							 pid,           //type pid_t
							 th_id,         //type uint64_t

							 pStrSpecErrCode,						//null-terminated C-string
							 !strLastErrInfo.empty() ? "(" : "",	//std::string
							 strLastErrInfo.c_str(),				//std::string
							 !strLastErrInfo.empty() ? ") " : ""	//std::string
							 );

	if(nchLnBuff > 0)
	{
		if(!pBuff)
		{
			//Reserve memory (do not throw - return null instead)
			pBuff = new (std::nothrow) char[nchLnBuff - 1 + nchLen + SIZEOF(pStrSuffix)];
			if(!pBuff)
			{
				//Failed
				assert(false);
				break;
			}

			nchLnBuff++;
		}
		else
		{
			//All done, add message
			memcpy(pBuff + nchLnBuff, pMsg, nchLen * sizeof(char));
			memcpy(pBuff + nchLnBuff + nchLen,
				   pStrSuffix,
				   SIZEOF(pStrSuffix) * sizeof(char));

			szcbLnStr = nchLnBuff + nchLen + SIZEOF(pStrSuffix) - 1;

			break;
		}
	}
	else
	{
		//Error
		assert(false);
		break;
	}
}

if(pBuff)
{
	if(szcbLnStr)
	{
		//Now we can write it into a file
		FILE *pFile = g_TxtLogFile.GetTxtLogFile();
		if(pFile)
		{
			if(fwrite(pBuff, 1, szcbLnStr, pFile) == szcbLnStr)
			{
				fflush(pFile);

				//Done
				bResult = true;
			}
		}
	}

	//Free memory
	delete[] pBuff;
	pBuff = nullptr;
}
If you were able to spot it, then good for you! I couldn't find it by statically analyzing my code. Keep in mind though that in an actual production project you may have thousands of lines of code that need to be analyzed and not just an isolated chunk of code, like I showed above.
The issue in the code that I showed above is that it reserves N bytes from the heap in the new (std::nothrow) char operator, but writes N+1 bytes into it in one of the memcpy calls that follow. Or, in other words, it overwrites its allocated buffer by just one byte. In most cases this would probably not cause any significant issues, but once in a while, when memory segments were allocated very close to each other, my piece of code would corrupt the beginning of someone else's memory, which would result in that other component crashing at some later time.
So how did I find it?
It would be great for me to have found it using my deductive reasoning. But I should admit that I am not that smart. I located the bug by using the "Address Sanitizer" in Xcode.
Example of Address Sanitizer in Xcode
After having set up my build schemes like I showed above, I used the Debug scheme to set up the "Address Sanitizer" in the "Diagnostics" pane in Xcode. This is just a single checkbox:
Product -> Scheme -> Edit Scheme -> select Run -> Diagnostics pane.
After that I rebuilt my project and ran it with a debugger.
And almost immediately I got a crash! (And no, this was a good thing.)
The way some profiling and debugging tools work is that they include special debugging code during the build process of your app. And then when you run the app, or at run-time, the extra debugging code executes additional safety checks. If those checks fail, the debugging code immediately crashes the process. A crash could be either caught with a debugger (in Xcode), or without a debugger, it will create a so-called crash log report that can be analyzed later.The benefit of this method (in case of a memory corruption bug) is that the moment when some part of your code overwrites some memory area that it does not control could be caught by the debugging code, and thus this can give you the exact moment when the bug happens.
You can read more about debugging tools in Xcode at the official documentation page.
So in my case the "Address Sanitizer" crashed the process by throwing the "Heap buffer overflow" exception in the exact spot where the memcpy was overwriting the allocated buffer in my code:

I couldn't have asked for a better outcome!
The next thing to do was to review that specific function and to find the bug. It took me less than 5 minutes to find it.
The bug was in the new operator that allocated one-less byte. It should've been this:
The debugging tools were helpful even to a greater degree. When I clicked on the report list in the left pane of the Xcode, the code editor on the right showed the function that allocated the memory in question (my faulty new) and the thread that called it:

Then when I clicked on the address of the allocation in the left pane, the right window displayed the binary memory contents at the time of the crash, and a pop-over prompt told me exactly what happened:

I think that these kinds of tools are totally indispensable and should be used by all developers.
I personally enable all available sanitizers in the "Diagnostics" pane for my Debug build schemes for all my projects in Xcode. It won't hurt to catch some latent bugs during the early development stage.
More On Sanitizers in Xcode
Since I started talking about the address sanitizer in Xcode, let me expand a bit more on this subject. I created a test GitHub project to illustrate the basic use of sanitizers in Xcode. It covers the following:
Address Sanitizer
I already showed the basic use of the Address Sanitizer in Xcode. It is by far the most useful sanitizer in Xcode. It catches a wide range of coding bugs. Just to name a few:
- Out-of-bounds heap reads and writes: this is a situation when your code reads or writes beyond the bounds of a memory buffer that was previously allocated from the heap. I illustrated this scenario in code, here for reads, and here for writes.
This bug is especially insidious because it may not manifest itself when it first happens. My example above is exactly that scenario. The process in question may crash at random times that will seriously complicate debugging.
If you look at my code that does the crash, say for writing:
C++[Copy]///Crash the process by writing into an illegal address void Crash::crashWithIllegalWrite() { char* pMem = new (std::nothrow) char[128]; writeToMemory(pMem); delete[] pMem; } void Crash::writeToMemory(char* pMem) { assert(pMem); for(size_t i = 0;; i++) { pMem[i] = (char)(int)i; } }If you attach the debugger to the CrashMe process and activate option 2 for: "Crash with an illegal write", when the process crashes the debugger will stop on the memory write that caused it. Try to do it first without the address sanitizer enabled (for that use my "CrashMe - Debug" build scheme.) See that the value of the variable
iis way past the bounds of the allocated memory buffer, which is128:
The process only crashed at the index
iinto our buffer being at490733440, which is a totally arbitrary value. This means, that in all probability, the process would have not crashed on the actual write that caused an overflow.Now try to enable address sanitizer and build the CrashMe project (using my "CrashMe - Debug + Sanitizers" build scheme) and run it with the same option 2. This time the address sanitizer will crash it on the exact out-of-bounds memory write for the index value
ibeing128, which is the first illegal write into that buffer:
This is very helpful, isn't it?
- Buffer-overflow bug: this is the same class of bugs as the one above, but when the buffer is a local stack memory. This most often happens when the buffer comes from a local C or C++ variable.
The danger in overflowing a stack buffer is that many CPUs also store return addresses of functions in the same stack. This means that such bug may be exploited by an adversary to execute an arbitrary code in your program.
- Use-after-free bug: this bug happens when you continue using the heap memory after it was freed with a
deleteorfreefunction. Something similar to this:Note that in a real-life scenario this bug may not be as evident as in the code snippet that I showed above. Quite often the memory could be freed (or released) by one function and continued to be used by another, often running in a different thread. Another good example of this bug could be found in various clean-up functions that are called from a class destructor after the memory is freed too early.
In most cases, without the address sanitizer, your code will continue running just fine with the use-after-free bug. This happens because the operating system does not immediately re-use the freed memory. The danger of the use-after-free bug though is in how an adversary can exploit it to overwrite another (critical) memory allocation in your program.
- Double-free bug: similar to the bug above, this situation happens when a heap-allocated memory is freed twice. I showed it with a code example here:
Again, the real-life scenario of this bug is rarely as simple and straightforward as I showed above.
- Stack-use-after-return bug: this bug happens when a local stack memory pointer is passed outside of the function scope. I showed it with a code sample here:
C++[Copy]
void Crash::demoUseOfStackAfterReturn()
{
	const char* pGreeting = useOfStackAfterReturn();

	printf("%s\n", pGreeting);      //bug!
}

const char* Crash::useOfStackAfterReturn()
{
	std::string str = "Hello world!";
	const char* pstr = str.c_str();

	return pstr;                    //bug!
}
As you can see the
Crash::useOfStackAfterReturnfunction returns an address of a string that was stored in a local variablestr, which is then used in theCrash::demoUseOfStackAfterReturnfunction. The problem happens because the pointer used in theCrash::useOfStackAfterReturnfunction goes out of scope, or becomes invalid when the execution returns from that function. In that case this bug can let an adversary override the memory that may be allocated by another function.This bug is similar to the use-after-free bug that I described above.
The list above is not exhaustive. It's just what came to mind when I was making my CrashMe demo app.
Thread Sanitizer
This sanitizer deals with race conditions in your app. It basically looks for simultaneous unsafe access to shared memory from more than one thread. This class of bugs is very difficult to diagnose as they are totally timing dependent.
I have illustrated it with a code example here:
///Demonstrate a race-condition
int Crash::demoRaceCondition(int nNumberThreads)
{
	int nResult = 0;

	pthread_t* threads = new (std::nothrow) pthread_t[nNumberThreads];
	assert(threads);

	//Create threads for our tests
	for(int t = 0; t < nNumberThreads; t++)
	{
		int nErr = pthread_create(&threads[t], nullptr, threadRaceCondition, (void*)&nResult);
		assert(nErr == 0);
	}

	//Wait for threads to finish
	for(int t = 0; t < nNumberThreads; t++)
	{
		pthread_join(threads[t], nullptr);
	}

	//Free memory
	delete[] threads;

	return nResult;
}

void* Crash::threadRaceCondition(void *arg)
{
	int* pInt = (int*)arg;
	assert(pInt);

	for(int i = 0; i < ITER_PER_THREAD; i++)
	{
		(*pInt)++;
	}

	return nullptr;
}
The code sample above starts several threads, implemented in the Crash::threadRaceCondition function, that try to increment the shared variable nResult all at the same time. This is a classic example of a need of a synchronization lock, or of an atomic CPU instruction for the increment:
But since we didn't use any of those, the result that we return at the end of the Crash::demoRaceCondition function is akin to a pseudo-random number generator. It is never what we would expect from it.
To catch this bug, compile and run the CrashMe app with the Thread Sanitizer enabled. For that use my "CrashMe - Debug + Sanitizers" build scheme.
Unfortunately the Thread Sanitizer cannot be used together with any of the Address Sanitizers and with the Malloc Scribble. Thus, to enable the Thread Sanitizer, make sure to disable the other two sanitizers in your build scheme settings.
After you run the CrashMe process once, the Thread Sanitizer will display any potential race conditions in the source code:

Such output can literally save you hours of head-scratching debugging later.
Undefined Behavior Sanitizer
There are many aspects of an undefined behavior in a compiled C/C++ code. I will show one that can be somewhat counterintuitive for anyone that is coming to a RISC architecture (such as ARM64) from a CISC one (such as x86-64.) Many of the RISC chips can provide efficiency by working with memory addresses that are allocated on a certain boundary. Thus unallocated memory read or write can cause an unexpected crash or degradation in performance.
The best way to explain this is with the code example:
#if defined(__aarch64__)

///Demonstrate undefined behavior bug (available on ARM64 CPU)
void Crash::demoUndefinedBehavior()
{
	char buff[32] = {};

	char* pSrc = buff;

	short v1 = *(int*)pSrc;
	pSrc += sizeof(v1);

	int v2 = *(int*)pSrc;       // Undefined behavior: unaligned read on an ARM CPU!
	pSrc += sizeof(v2);

	*(int*)buff = v1 + v2;
}
#endif
Note that I'm using the__aarch64__preprocessor definition to compile theCrash::demoUndefinedBehaviorfunction only for the ARM64 architecture. The code above will not be a bug for the Intel x86-64 architecture.
As you can see, the second read from pSrc is done from an address that is not aligned on a 4-byte boundary. This could be a very alien thing to anyone who is not familiar with an ARM64 architecture.
In most cases, the compiler will take care to perform proper variable alignments. But, if you do more elaborate pointer manipulation, like I showed above, you may face some very unexpected results. Luckily, the Undefined Behavior sanitizer in Xcode can quickly root out such bugs and display a warning in the source code:

Note that you will need to run your program with the Undefined Behavior sanitizer enabled at least once, for the warning to appear in the source code.
The sanitizers that I showcased above are just a small subset of the available debugging tools in Xcode. Refer to the official Apple documentation for more details.
How To Debug Early Process Initialization (eg. Launch Daemons)
In regards to my previous example, I faced a dilemma. The allocation (and a memory corruption) bug was happening early in the initialization of my process. Moreover, it was a launch daemon that was starting early during the boot sequence, way before any user desktop was even loaded.
So how would you attach a debugger to such a process?
There are probably some tools, or techniques to accomplish this. I usually use the following approach:
- I place the following chunk of code somewhere at an early execution area in the process, such as one of the global constructors, or right at the beginning of the
main()function:C++[Copy]#ifdef DEBUG static bool gbKeepGoing = true; for(; gbKeepGoing; ) { usleep(1000 * 100); //100 ms } #endifThe code snippet above will generate a controlled infinite loop in the target process. I purposefully place the
usleepfunction into it to ensure that my loop does not consume too many CPU cycles, that may make it hard to work with.Additionally, I make sure to place my code into the
DEBUGpreprocessor scope to ensure that it doesn't get included into a production, or release build. - The code above will halt my launch daemon at its early initialization stage. So when the user desktop loads up and I can start my debugger (Xcode), I attach to the process for my launch daemon.
For Xcode, go to
Debug->Attach to Process by PID or Nameand type your process name:
Then click
Attachto attach the Xcode debugger to your process.Note that it is highly advantageous if your binary is built for Debug configuration (or with optimizations disabled.)
Additionally, to be able to attach to your binary with a debugger it should have the
com.apple.security.get-task-allowentitlement enabled (that can be set via theCODE_SIGN_INJECT_BASE_ENTITLEMENTSswitch in Xcode). This option is mandatory for debugging a process if the System Integrity Protection (SIP) is enabled in macOS. - When (Xcode) debugger attaches to your process, place a breakpoint on the
usleep(1000 * 100);line. The execution should immediately break there:
- After that place your other breakpoints that were the reason for you to attach to this process in the first place.
I am sure that it is obvious by now that those other breakpoints must follow the one that we just broke at in the code flow of your app.
- To break out from our debugging infinite loop we need to set our global
gbKeepGoingvariable to false. For that execute the following in the command window in the Xcode:
This should set
gbKeepGoingto false. - If all goes well, by now your debugging infinite loop will be disabled and you can resume your program (by going to
Debug->Continuein the Xcode menu) and wait for your actual breakpoints to trigger.
This technique is as manual as they come. So I will be glad to hear if you know of a better way to debug your process at an early stage. If so, leave a comment below.
How To Debug Post-Mortem Crashes Using Crash Log Files
If you are able to attach a debugger (Xcode, or any other one) and catch the crash with it, consider yourself lucky. In most cases you won't be able to do it. Your app could be crashing in a production environment on your client's computer where you cannot install and run your debugging tools.
In that case there's another technique that can help you diagnose the cause of the crash.
When a crash takes place in a binary process, macOS automatically creates a special file, called crash log, with the information about the crash.
Unfortunately macOS does not seem to generate memory dumps like Windows.
You can locate crash log files in one of the following directories on the computer where crash happens:
- If the crashed process was running under a logged in user credentials:
/Users/<UserName>/Library/Logs/DiagnosticReportsWhere
<UserName>is the user name for the account. - If the crashed process was running as root:
/Library/Logs/DiagnosticReports
Look for files with the .ips extension that begin with your application name. This is a mere text file that contains information about the crash in your app. But before you can use it, you may need to do a few operations with it.
To better illustrate the process of analyzing crash log files, let me use my CrashMe example. That demo app is designed to crash in various controllable scenarios. To fully test how it would behave in a production environment, build it with the "CrashMe - Release" build scheme.
Then locate the release binary. You can do it in Xcode by going to Product -> Show build in Finder in the main menu, and then navigate to Products -> Release folder in Finder. It will contain two important binary files:

- Binary Mach-O executable file for your program. This is the compiled binary file with your app's logic that you will code-sign and distribute to your end-users, or clients. It is also created when you Archive your project in Xcode.
.dSYMfile, with the file name of your app. This is your private file that you should never ship to your end-users. It contains source code symbols for your binary app that will help you debug crashes in it.By including a
.dSYMfile in your production release along with your binary file, you will make it easier for anyone to reverse engineer your app.
To imitate a crash in a production environment copy the binary file for your app (in my case CrashMe) into another Mac. Ideally you would use a macOS installed in a virtual machine (VM). Or, if you don't have a VM, rename the .dSYM file.
Quite often, when your binary process crashes on a computer that does not have its corresponding .dSYM file, the crash log will contain information that is hardly useful for debugging. For instance, if I run my CrashMe app and choose the option 1, or to "Crash with an illegal read", the crash log file will contain the following snippet of the crash:
Process:               CrashMe [644]
Path:                  /Users/USER/Desktop/CrashMe
Identifier:            CrashMe
Version:               ???
Code Type:             ARM-64 (Native)
Parent Process:        zsh [639]
Responsible:           Terminal [391]
User ID:               502

Date/Time:             2023-06-25 14:17:58.3072 -0700
OS Version:            macOS 13.3 (22E252)
And also:
Crashed Thread:        0  Dispatch queue: com.apple.main-thread

Exception Type:        EXC_CRASH (SIGABRT)
Exception Codes:       0x0000000000000000, 0x0000000000000000

Thread 0 Crashed::  Dispatch queue: com.apple.main-thread
0   libsystem_kernel.dylib                     0x1808e8724 __pthread_kill + 8
1   libsystem_pthread.dylib                    0x18091fc28 pthread_kill + 288
2   libsystem_c.dylib                          0x18082dae8 abort + 180
3   libsystem_c.dylib                          0x18082ce44 __assert_rtn + 272
4   CrashMe                                    0x100baf5e8 0x100bac000 + 13800
5   CrashMe                                    0x100baf440 0x100bac000 + 13376
6   CrashMe                                    0x100baef04 0x100bac000 + 12036
7   CrashMe                                    0x100bae8c0 0x100bac000 + 10432
8   dyld                                       0x1805c7f28 start + 2236
Make sure to open the.ipscrash log file with the Console app on macOS. You can find it inApplications->Utilitiesfolder:

And although we can see from the first snippet of the crash log that it was indeed my CrashMe process, that was compiled for the ARM-64 (Native) architecture, that was running on macOS 13.3 (22E252); and that the second snippet of the crash log gives us the reason for the crash, or SIGABRT, and that our Thread 0 caused the crash, but its call-stack, or the most important part of the crash report, looks hardly useful.
The call-stack contains a chain of function calls that lead to a crash. It is usually read from the bottom-up, meaning that the first function that began executing in our thread is presented at the very bottom.
So if we start analyzing the call-stack, we can tell that the crash was caused by some sort of an assertion (the __assert_rtn + 272 line) that later aborted the process (the abort + 180 line), but anything leading to it in our CrashMe process is represented by pure memory addresses and offsets.
This doesn't tell us much:
4   CrashMe                                    0x100baf5e8 0x100bac000 + 13800
5   CrashMe                                    0x100baf440 0x100bac000 + 13376
6   CrashMe                                    0x100baef04 0x100bac000 + 12036
7   CrashMe                                    0x100bae8c0 0x100bac000 + 10432
When I was preparing my CrashMe demo app I noticed that Xcode 14 was not removing private symbols (or function names in my case) from a compiled production (Release) binary. This is a very unexpected behavior. So keep this in mind when building your production binaries as they may inadvertently contain your private symbols!To disable this behavior in Xcode, make sure to turn off
Deployment Postprocessingin the build settings for the Release builds:

Let's review next how we can make our call-stack more amenable for reading.
How To Symbolicate a Crash Log File
To convert raw memory addresses in a crash log to the names of symbols in your source code, you will need to symbolicate it. Apple provides a whole document on how to do it with Xcode, but it mostly applies to crash logs received from their AppStore. In our case, our app is not in the AppStore, so we have to do it manually.
Note, and it is very important: to be able to symbolicate a crash log you will need all of these files:
- Crash log
.ipsfile: that contains information about a crash. - Binary Mach-O executable file: that contains your executable code that crashed.
.dSYMfile: that contains private symbols that tie your executable file to the source code.
If you don't have the.dSYMfile that matches your binary Mach-O executable file, that was created when you built it, you will not be able to properly symbolicate your crash log!Thus, it is very important to keep the binary Mach-O executable file and its corresponding
.dSYMfile together, along with the source code files that were used to build the executable! Make sure to keep those in a private place.
My preferred way to symbolicate a crash log is by using a third-party tool called MacSymbolicator:
- First copy the
.ipscrash log file into the matching release build folder for your project:
- Then start the
MacSymbolicatorapp and drag-and-drop the.ipscrash log file into its left pane, and the.dSYMfile with symbols into the right one. Then click "Symbolicate": - This will open a text window with a crash report, similar to the one shown by the Console app, but with the call-stack and other private symbols translated. This is what I got for my call-stack:
CrashMe-2023-06-25-141758.ips (Symbolicated)[Copy]
Thread 0 Crashed:: Dispatch queue: com.apple.main-thread 0 libsystem_kernel.dylib 0x1808e8724 __pthread_kill + 8 1 libsystem_pthread.dylib 0x18091fc28 pthread_kill + 288 2 libsystem_c.dylib 0x18082dae8 abort + 180 3 libsystem_c.dylib 0x18082ce44 __assert_rtn + 272 4 CrashMe 0x100baf5e8 Crash::writeToMemory(char*) (in CrashMe) (Crash.cpp:166) + 13800 5 CrashMe 0x100baf440 Crash::crashWithIllegalWrite() (in CrashMe) (Crash.cpp:156) + 13376 6 CrashMe 0x100baef04 Crash::DoCrash(CRASH_TYPE) (in CrashMe) (Crash.cpp:0) + 12036 7 CrashMe 0x100bae8c0 main (in CrashMe) (main.cpp:84) + 10432 8 dyld 0x1805c7f28 start + 2236 -
If you clicked the "Symbolicate" button but the
MacSymbolicatorapp shows an empty window, this most certainly means that your.dSYMsymbols file does not match the build of your binary file. You can double-check this by clicking the "View Logs" button.The
MacSymbolicatorapp in that case may show the following not very helpful message:Did not find anything to symbolicate for process _____.
Make sure to match the binary file with its
.dSYMfile that is produced during the build in Xcode.You can check if the two are matching by using the
UUIDvalue:- Run the following command to get the UUID from the binary Mach-O file:
In my case this produced the following output for my universal binary file:
Bash[Copy]UUID: 527171B9-53C3-3540-9485-4FB38608A783 (x86_64) /path/to/binary_file UUID: 65A095CD-7F3E-3E51-917C-D744DB22D9B7 (arm64) /path/to/binary_file - Then if I look for the following section in the
.ipscrash log file:CrashFile.ips[Copy]Binary Images: 0x10bda4000 - 0x10bdb3fff binary_file (*) <65a095cd-7f3e-3e51-917c-d744db22d9b7> /private/tmp/*/binary_file 0x7ff80afd5000 - 0x7ff80afdefef libsystem_platform.dylib (*) <4ff3bd2f-2167-3ee6-a55d-384703bdf1f5> /usr/lib/system/libsystem_platform.dylib 0x7ff80ae52000 - 0x7ff80aed9ff7 libsystem_c.dylib (*) <5ca0d0cf-fcdd-3180-af7b-f137fe1e7aca> /usr/lib/system/libsystem_c.dylib 0x7ff80ac4b000 - 0x7ff80ace35cf dyld (*) <5db85b72-c63a-3182-91e5-5c942ec30e48> /usr/lib/dyld 0x7ff80afa5000 - 0x7ff80afb0fff libsystem_pthread.dylib (*) <8cb0b396-011f-31f2-8915-94cde1abae84> /usr/lib/system/libsystem_pthread.dylibAs you can see the UUID for my ARM64 build that crashed, or
65A095CD-7F3E-3E51-917C-D744DB22D9B7, matches what I can see in the.ipsfile. This means that the two match, and you can use the.dSYMfile to symbolicate the crash log for that binary file.
- Run the following command to get the UUID from the binary Mach-O file:

As you can see the call-stack after symbolication looks so much better than before. Now we can clearly see the sequence of events that lead to the crash, and that the Crash::writeToMemory(char*) function in Crash.cpp on line 166 caused the crash.
The process of a crash analysis, or a post-mortem crash analysis, as it is often called in a somewhat grim fashion, is quite complex and cannot be covered in its entirety in just one blog post. If you feel like you want me to share more on this subject, leave a comment below.
Conclusion
This is the conclusion of my three-part blog post about programming for macOS.
These were just a few things that came to mind that I wanted to share with my readers. If you feel like you want to know more on the subject of the low-level macOS programming, don't hesitate to let me know.
Happy coding!