
Intro
If you ever wrote a Windows Explorer shell extension, or dealt with a credential provider, you probably came across the SHStrDupW function.
There's also its little brother function, SHStrDupA, that deals with the 8-bit ANSI strings. But due to its obvious limitations, let's hope that you don't have to use it.
The function is declared as such:
Its first input argument is a C-string. Then the function allocates a string copy (or a duplicate, as its name suggests) and returns it in the second argument, or in ppwsz.
Then the documentation states that the string returned in the second argument must be freed with a call to CoTaskMemFree.
I'm not sure about you, but when I see this function it always makes me wonder, "What happens when the second parameter already has a previously allocated string?"
Something similar to this use case:
LPWSTR pwsz = NULL;
SHStrDupW(L"Hello", &pwsz);
SHStrDupW(L"Bye!", &pwsz);
CoTaskMemFree(pwsz);
My question was, "Would SHStrDupW automatically free the memory from the second parameter if it was not NULL?"
The documentation did not answer that question. Moreover if you run the code example above, it will run fine and you won't notice any issues. But is it correct?
To answer my questions I decided to reverse engineer that function and to see it for myself.
And in the process I will share a couple of reverse engineering techniques.
Reverse Engineering With WinDbgX
This function is simple enough that we can understand what it's doing by just analyzing its assembly code. And for the sake of presenting something new, let me reverse it using an ARM64 build.
If you haven't noticed the latest slew of ARM64 laptops, they are clearly here to stay. So I'm going to broaden my horizons and switch away from primarily reverse engineering x86/x64 assembly to ARM64. That architecture is really cool.
Also since the function is quite simple, we don't really need any fancy tools like Ghidra or other decompilers. Let's do it the old school, using the new WinDbgX debugger. After all, it's free and quite easy to set up.
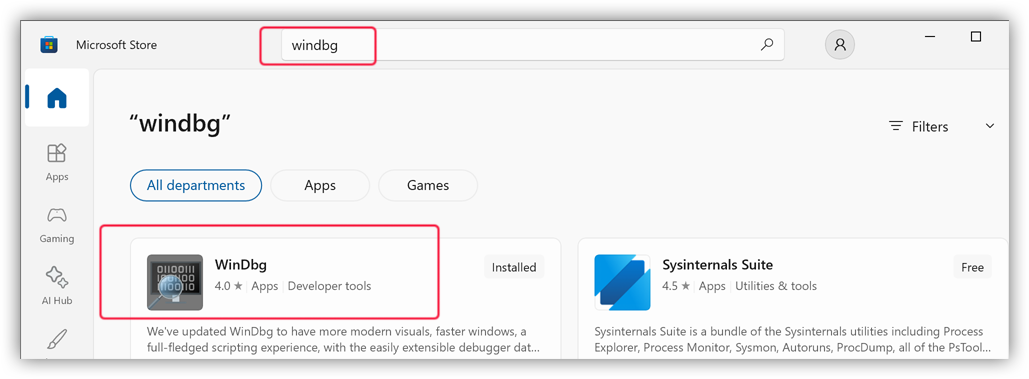
You can download WinDbgX from the Windows Store by searching for it, or by using this link for the standalone app package installer.
Unlike its predecessor the newly installed WinDbgX will be ready for debugging (or reverse engineering) as soon as you install it.
Finding Where Is The SHStrDupW Function
Before we begin reverse engineering it we need to know where is the assembly code for the SHStrDupW function.
The easy way to proceed is to check the documentation. It states that the DLL is the Shlwapi.dll. Thus, we need to check there.
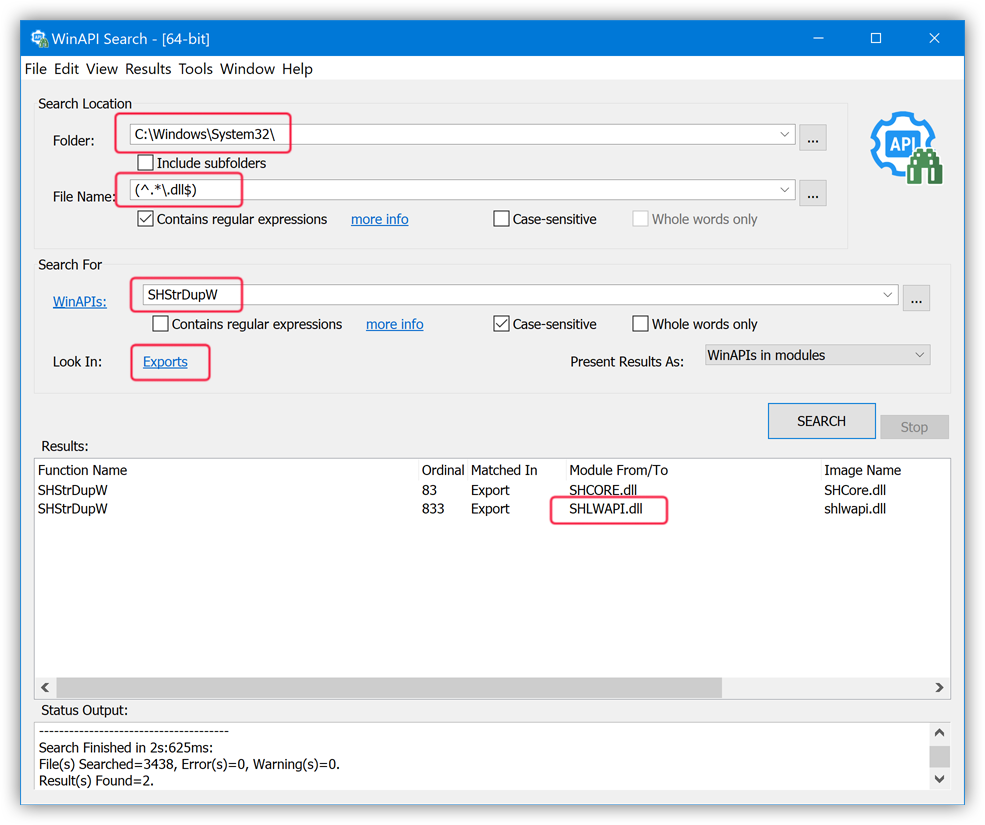
Note that the documentation may be wrong.If such is the case, or if you want to confirm it, you can use the WinAPI Search tool to search for the
SHStrDupWexport among all the DLLs in the System32 folder:WinAPI Search tool with the "Binary File Preset" to search all DLLs in the System32 folder for theSHStrDupWexportAs you can see in the output, the
SHLWAPI.dllis indeed one of the DLLs where that function is exported from. Thus, we're on the right track.
Since WinDbg is not a tool for the binary static analysis we need to be a little bit creative to know how we can view assembly code in the Shlwapi.dll using WinDbg.
There are many ways of doing it. Let me show you one of those methods.
Note that if you have Visual Studio with a C++ compiler handy my preferred way of researching this is to code a very simple console app that calls the function that I want to test, i.e.SHStrDupW.Example:
C++[Copy]int main() { LPWSTR pwsz = NULL; SHStrDupW(L"Hello", &pwsz); CoTaskMemFree(pwsz); return 0; }Then you can simply run that test console app from under a debugger, like WinDbgX (or just from the Visual Studio itself) and put a breakpoint on the
mainfunction to get to theSHStrDupWcall.In this case, let me show you a different method to get to it though.
Let's try to get to the SHStrDupW function from an existing application using a live debugging session. It will also show us ways to find where a specific function can be used in case you need it for a more complex reverse engineering exercise.
Finding Apps That Import The SHStrDupW Function
Since we decided to use a live debugger that executes code, we can't really execute a DLL all by itself. We need to map, or to load it into some process.
For that let's use the WinAPI Search tool to find it:
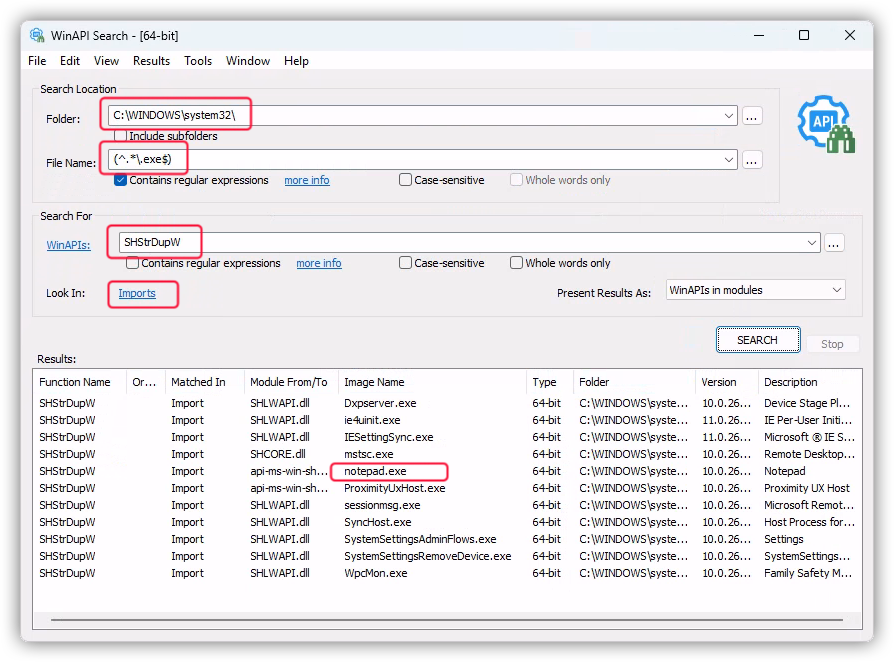
SHStrDupW import
In the screenshot above I used the WinAPI Search tool to look for all executables (with the .exe extension) that import the SHStrDupW function. I am mostly interested in the Microsoft default apps, that are stored in the C:\Windows\System32\ directory.
The tool returned a bunch of hits. I picked a familiar one that I would want to inspect: notepad.exe.
Now when we have an executable that uses the SHStrDupW function we need to load it into WinDbgX for a dynamic analysis, or for a live debugging session.
Dynamic Analysis With WinDbgX
Fire up an instance of WinDbgX that you previously installed. Then head out to File -> Launch Executable and pick the notepad.exe from the C:\Windows\System32\ directory.
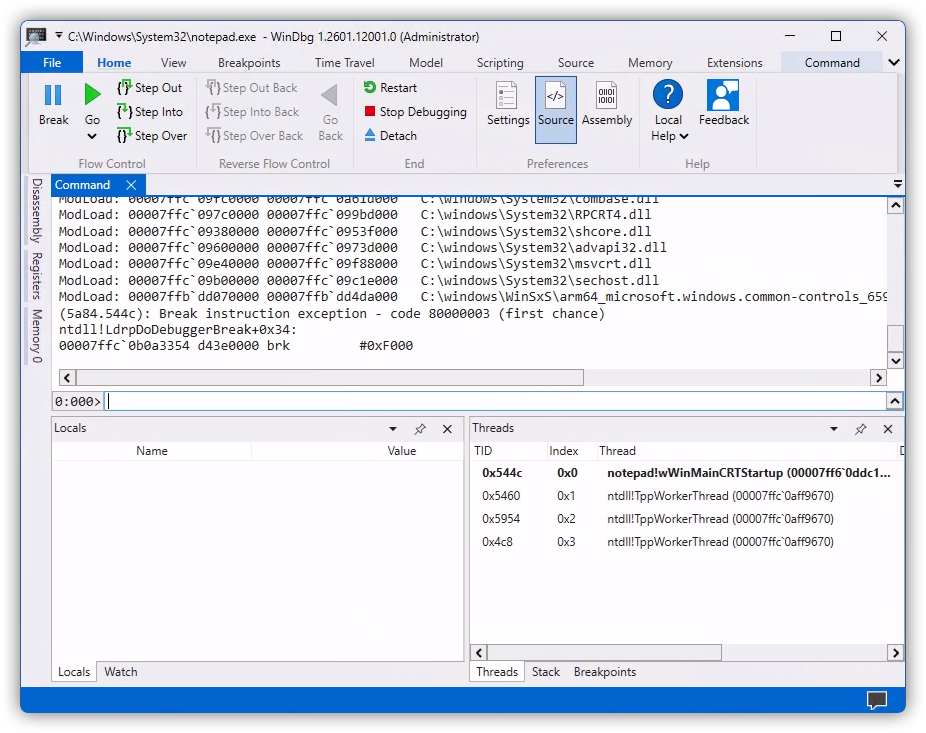
When done, the WinDbgX should launch the Notepad and immediately break into it with a debugging breakpoint.
Notepad
I am personally not a big fan of a default window layout in WinDbgX. I switch it to show a disassembly and register panes as well.To do that go to View -> Layouts and pick "Disassembly" from the drop-down list. The WinDbgX will change the layout of its panes to include those two. After that you can drag them around to match what I will be showing in the screenshots below.
When the initial breakpoint hits the "Disassembly" pane may look something like this:
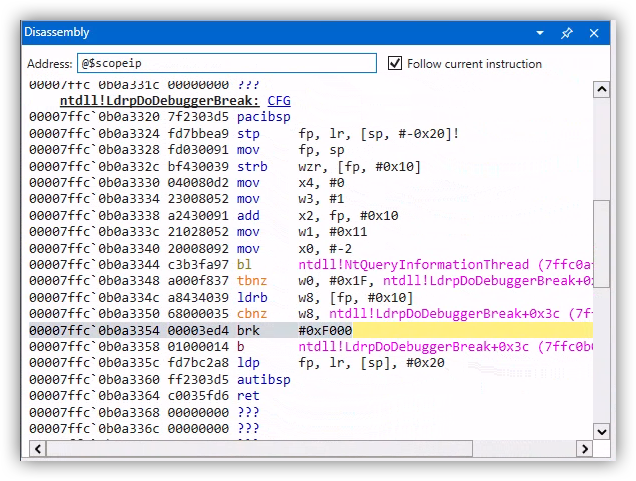
ntdll!LdrpDoDebuggerBreak
As you can see the debugger broke in the ntdll!LdrpDoDebuggerBreak function with a breakpoint that was hit as soon as the notepad.exe was mapped into memory, but before it had a chance to run. This is a good way for us to configure WinDbg for any further debugging.
At this point we can just go straight to it and try to view the assembly code for the SHStrDupW function using the u command:
Note that I'm prefixing my function name with a module name (without its file extension) followed by an exclamation mark:shlwapi!SHStrDupW.That is WinDbg's way of specifying the full function name which could be handy in case multiple modules have a similar function name.
But an attempt to display assembly code for the SHStrDupW function resulted in an error that WinDbg "cannot resolve" it. What is going on there?
Let's check if the shlwapi module was mapped, or loaded, at that point in time using the lmi command:
0:000> lmi
start             end                 module name
00007ff6`0ddc0000 00007ff6`0de16000   notepad    (pdb symbols)          C:\Windows\System32\notepad.exe
00007ffb`dd070000 00007ffb`dd4da000   COMCTL32   (deferred)
00007ffc`06870000 00007ffc`069c9000   msvcp_win   (deferred)
00007ffc`06c10000 00007ffc`06e39000   ucrtbase   (deferred)
00007ffc`06e40000 00007ffc`06e9e000   win32u     (deferred)
00007ffc`06eb0000 00007ffc`07086000   gdi32full   (deferred)
00007ffc`07090000 00007ffc`0769a000   KERNELBASE   (deferred)
00007ffc`09380000 00007ffc`0953f000   shcore     (deferred)
00007ffc`09600000 00007ffc`0973d000   advapi32   (deferred)
00007ffc`09750000 00007ffc`097b5000   GDI32      (deferred)
00007ffc`097c0000 00007ffc`099bd000   RPCRT4     (deferred)
00007ffc`09b00000 00007ffc`09c1e000   sechost    (deferred)
00007ffc`09c30000 00007ffc`09d90000   KERNEL32   (deferred)
00007ffc`09e40000 00007ffc`09f88000   msvcrt     (deferred)
00007ffc`09fc0000 00007ffc`0a61d000   combase    (deferred)
00007ffc`0ac80000 00007ffc`0aeef000   USER32     (deferred)
00007ffc`0af40000 00007ffc`0b35d000   ntdll      (pdb symbols)          C:\windows\SYSTEM32\ntdll.dll
As you can see, the shlwapi module is not loaded yet.
WinDbgX - Break On Module Load
So we need to wait until shlwapi module is loaded and then break into debugger. We can use the sxe command to do this:
Then let WinDbg resume the Notepad process to run using the "Go" UI button, or with the g command.
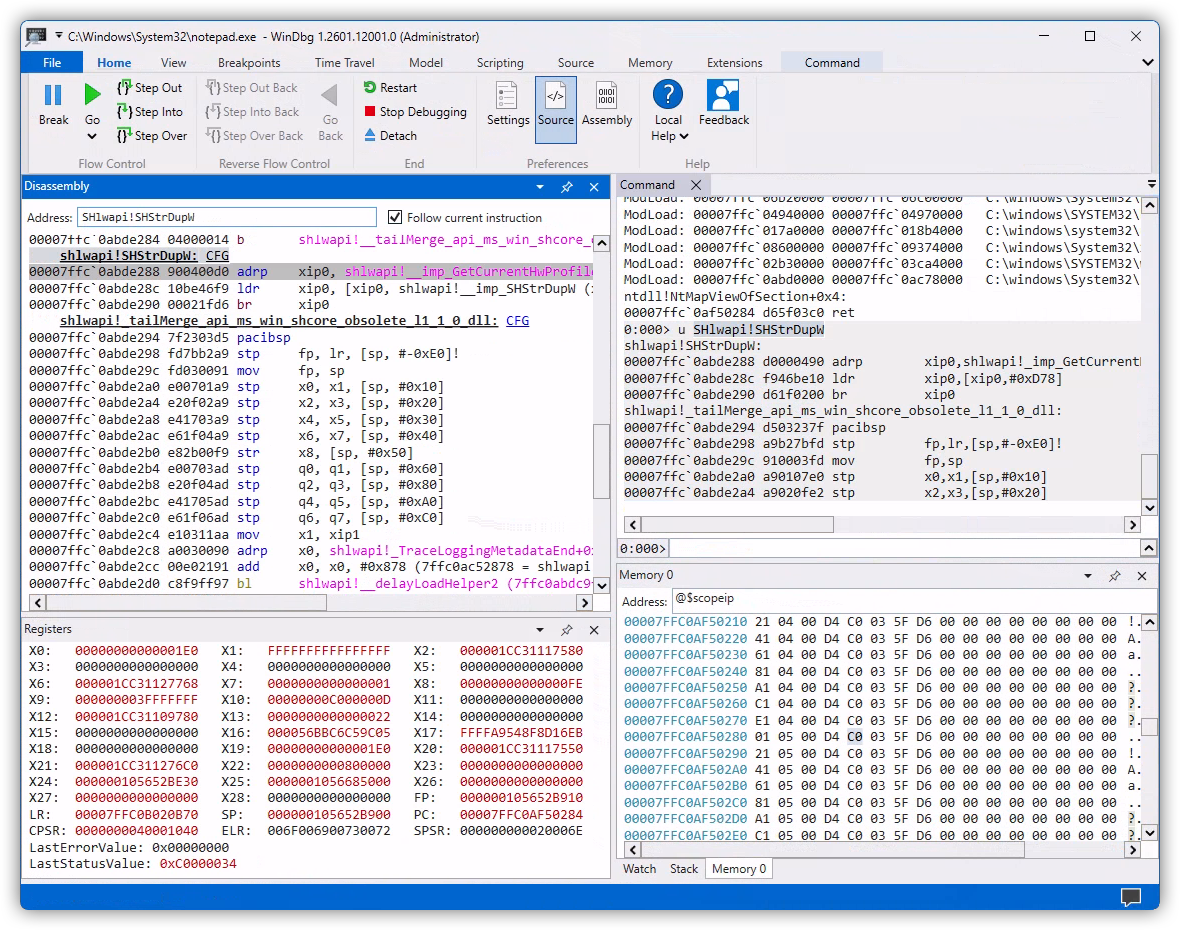
After that the debugger will hit that breakpoint in a very short time again. At that moment the debugger will be at a point when the shlwapi module was just mapped. We can confirm it by analyzing the command window output in WinDbg:
0:000> g
ModLoad: 00007ffc`095a0000 00007ffc`095f5000   C:\windows\System32\IMM32.DLL
ModLoad: 00007ffc`06b20000 00007ffc`06c00000   C:\windows\System32\bcryptPrimitives.dll
ModLoad: 00007ffc`04940000 00007ffc`04970000   C:\windows\SYSTEM32\kernel.appcore.dll
ModLoad: 00007ffc`017a0000 00007ffc`018b4000   C:\windows\system32\uxtheme.dll
ModLoad: 00007ffc`08600000 00007ffc`09374000   C:\windows\System32\SHELL32.dll
ModLoad: 00007ffc`02b30000 00007ffc`03ca4000   C:\windows\SYSTEM32\windows.storage.dll
ModLoad: 00007ffc`0abd0000 00007ffc`0ac78000   C:\windows\System32\shlwapi.dll
ntdll!NtMapViewOfSection+0x4:
00007ffc`0af50284 d65f03c0 ret
You can see the shlwapi.dll module being last in the list, as well as that the breakpoint was hit in the ntdll!NtMapViewOfSection function that just mapped our required module.
That is exactly what we need. Now we can retry running the u command to view the assembly code of the SHStrDupW function:
0:000> u SHlwapi!SHStrDupW
shlwapi!SHStrDupW:
00007ffc`0abde288 d0000490 adrp        xip0,shlwapi!_imp_GetCurrentHwProfileW (00007ffc`0ac70000)
00007ffc`0abde28c f946be10 ldr         xip0,[xip0,#0xD78]
00007ffc`0abde290 d61f0200 br          xip0
shlwapi!_tailMerge_api_ms_win_shcore_obsolete_l1_1_0_dll:
00007ffc`0abde294 d503237f pacibsp
00007ffc`0abde298 a9b27bfd stp         fp,lr,[sp,#-0xE0]!
00007ffc`0abde29c 910003fd mov         fp,sp
00007ffc`0abde2a0 a90107e0 stp         x0,x1,[sp,#0x10]
00007ffc`0abde2a4 a9020fe2 stp         x2,x3,[sp,#0x20]
Yay! It found something.
But hold off analyzing the output from that command yet. Let me give you a better way to view disassembly in WinDbgX.
WinDbgX - Disassembly Pane
To proceed further you will need to enable the "Disassembly" pane in WinDbgX, like I showed earlier.
Then to view the assembly code of a specific function copy and paste its full name, or its memory address, into the "Address" field on top and hit the Enter key on the keyboard. If the symbol name for the function was resolved, you should see its disassembly code in the pane below.
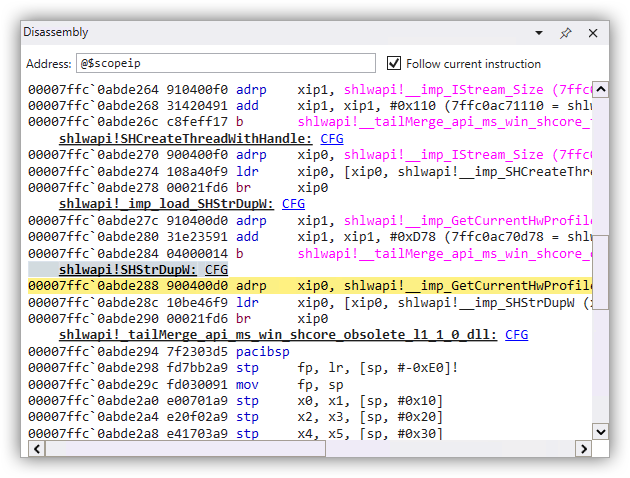
Here's what I got for the SHStrDupW function. Note that I used its full name, including the module name as such: SHlwapi!SHStrDupW
shlwapi!SHStrDupW
Let me copy and paste the assembly code for it:
    shlwapi!SHStrDupW: CFG
00007ffc`0abde288 900400d0 adrp    xip0, shlwapi!__imp_GetCurrentHwProfileW (7ffc0ac70000)
00007ffc`0abde28c 10be46f9 ldr     xip0, [xip0, shlwapi!__imp_SHStrDupW (x16+D78h)]
00007ffc`0abde290 00021fd6 br      xip0
Note the difference that I got from running the u command earlier. It's a subtle one, but it makes a world of difference when analyzing assembly - the u command gave me the instruction at the address 00007ffc`0abde28c as:
When the "Disassembly" pane showed this:
Having that symbol name shlwapi!__imp_SHStrDupW instead of just the offset #0xD78 makes a big difference.
Plus, the "Disassembly" pane presents assembly instructions in a neat color-coded way, with clear delineation of functions, while the u command just outputs it as text. Additionally, the "Disassembly" pane lets you double-click a register to highlight it elsewhere in the disassembled code, including its lower 32-bit forms. Which helps a lot!
So that is a small tip for anyone trying to analyze assembly code in WinDbgX.
That out of the way, let's try to see what does the assembly code in the shlwapi!SHStrDupW function do? It looks deceptively short at a first glance.
Delay Loading Function Shims
This is not a tutorial on the ARM64 assembly. So I will assume that you are familiar with some of it. But to help you out I'll be adding short comments on the right:
    shlwapi!SHStrDupW: CFG
00007ffc`0abde288 900400d0 adrp    xip0, shlwapi!__imp_GetCurrentHwProfileW (7ffc0ac70000)   ; xip0 = address of base of the memory page, or 7ffc0ac70000
00007ffc`0abde28c 10be46f9 ldr     xip0, [xip0, shlwapi!__imp_SHStrDupW (x16+D78h)]          ; xip0 = *(xip0 + D78h offset)
00007ffc`0abde290 00021fd6 br      xip0                                                      ; branch to address in xip0
The adrp instruction simply calculates the base address of a page in memory. In this case it points to 7ffc0ac70000. And then the ldr instruction reads 8 bytes from that address, plus the offset of 0xD78.
This is needed because of a limited instruction encoding size, which is 4 bytes for ARM64. Because of that a single instruction may not be capable of encoding a larger immediate, such as 7ffc0ac70D78 for instance.
Then the br instruction branches, or jumps (in the Intel parlance) to that address.
So our shlwapi!SHStrDupW function is technically just a shim that redirects execution somewhere else. Let's use WinDbgX to see where to:
In this case I used the dq command with the length specifier L1 to read one 8-byte QWORD from the address that we calculated earlier, or 00007ffc`0ac70d78. As a result, we can see that the branch is supposed to go to the 00007ffc`0abde27c address.
Let's see what function do we have there, again using the "Disassembly" pane:
    shlwapi!_imp_load_SHStrDupW: CFG
00007ffc`0abde27c 910400d0 adrp    xip1, shlwapi!__imp_GetCurrentHwProfileW (7ffc0ac70000)
00007ffc`0abde280 31e23591 add     xip1, xip1, #0xD78 (7ffc0ac70d78 = shlwapi!__imp_SHStrDupW)
00007ffc`0abde284 04000014 b       shlwapi!__tailMerge_api_ms_win_shcore_obsolete_l1_1_0_dll (7ffc0abde294)
I didn't copy the entire contents of that function because it is not relevant for us here.
When analyzing disassembled code it is very important to skip any parts that are not relevant for your investigation. Otherwise it is way too easy to get bogged down in the assembly code.
What matters in this case is the name of that function: shlwapi!_imp_load_SHStrDupW. The _imp_load_ prefix means that this is a delay loaded function.
You can read the link above for the exact definition of "delay loading" in Windows.In a nutshell, when you compile your native binary, by default the compiler instructs the loader of the PE file (with the produced binary code) to load it statically when that module is mapped into its host module, or into a process. This means that all imported functions will be resolved at the moment when your module is mapped.
With the "delay loading" a module is mapped only when any of its functions are used, or called. This alleviates the work-load on the host process when it starts by delaying the mapping of that specific module until it is actually used.
So we have one of such "delay loaded" modules on our hands here. It complicates our analysis just a bit more.
Let's see how we can overcome it. Because remember? Our final goal is to get to the assembly code of the SHStrDupW function that does its actual work, and not to analyze how delay loading works under the hood.
Resolving Delay Loaded Functions
I guess that you can analyze the "delay loading" function shim, the one that starts with the _imp_load_ prefix, to figure out the address of the actual function that was supposed to execute there. But my preferred hack is to let Windows do the work by just running that function once.
Let me briefly explain what happens under the hood.All "delay loaded" functions operate via a small branching shim, that we saw earlier. Under the hood that shim reads the function address to branch to from the PE file's Import Address Table, or IAT. Originally that address will point to the "delay loading" function/shim that will load the required module and will resolve all of its functions. That is quite a complex operation. After it finishes, the shim will update all function addresses in the IAT table to point to the resolved, or actual function addresses. So the next time the branching shim will redirect execution to the actual function that was just delay loaded.
After we run our shlwapi!SHStrDupW branching shim once, the next time it should point us to the actual address of the SHStrDupW function.
To do that let's put a breakpoint there and resume execution:
Then we need to trick Notepad to hit that breakpoint. This could be a challenge if we don't know where our needed function (or SHStrDupW) was used. In this case though, knowing that it is most certainly used by the Windows Explorer COM functions, let's trick Notepad to invoke one of the Explorer COM interfaces by going to File -> Open and ask it to open a file.
And sure enough, that hits our breakpoint right away:
shlwapi!SHStrDupW
Then let the Notepad go by issuing the g command and repeat the process to hit the same breakpoint the second time.
Now let's get the branch address as we did earlier:
Aha, the address is different! Let's disassemble it with the "Disassembly" pane:
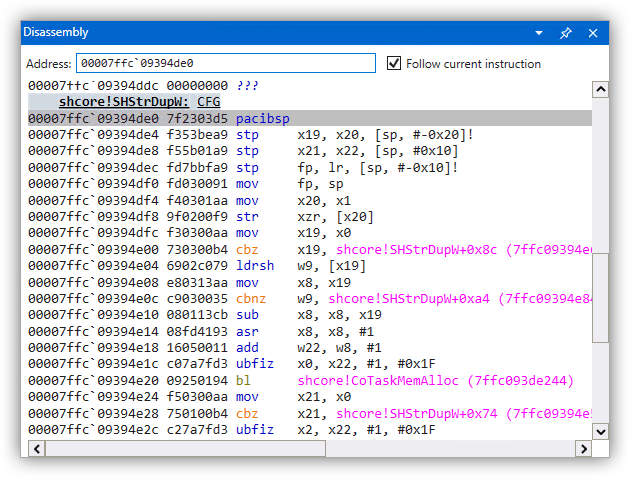
shcore!SHStrDupW
This looks like the function that we need.
By the way, notice that the actual function is in a different module, i.e.shcoreinstead ofshlwapilike the documentation had suggested. We kinda saw it earlier in the output of the WinAPI Search tool, remember? So having checked it first would've saved us some steps. But at least we didn't waste that time in vain. I hope that I was able to show you the workings of the "delay loaded" modules in the process.
Now it's time to analyze what the SHStrDupW does.
Decompiling The SHStrDupW Function
Let me copy the assembly code for the SHStrDupW function and put some comments on the right. It is not a very large function and is very beginner-friendly. Try to follow along:
    shcore!SHStrDupW: CFG
00007ffc`09394de0 7f2303d5 pacibsp                                                   ; pointer authentication instruction that scrambles the value in LR
00007ffc`09394de4 f353bea9 stp     x19, x20, [sp, #-0x20]!                           ; function prolog, save: x19, x20, x21, x22, fp, lr on the stack
00007ffc`09394de8 f55b01a9 stp     x21, x22, [sp, #0x10]
00007ffc`09394dec fd7bbfa9 stp     fp, lr, [sp, #-0x10]!
00007ffc`09394df0 fd030091 mov     fp, sp
00007ffc`09394df4 f40301aa mov     x20, x1                                           ; x20 = x1 = 2nd function argument, or 'ppwsz'
00007ffc`09394df8 9f0200f9 str     xzr, [x20]                                        ; *ppwsz = NULL
00007ffc`09394dfc f30300aa mov     x19, x0                                           ; x19 = x0 = 1st function argument, or 'psz'
00007ffc`09394e00 730300b4 cbz x19, shcore!SHStrDupW+0x8c (00007ffc`09394e6c) ; branch to error if 'psz' is NULL00007ffc`09394e04 6902c079 ldrsh w9, [x19] ; w9 = *psz, or read the first WCHAR
00007ffc`09394e08 e80313aa mov x8, x19 ; x8 = x19 = 'psz'
00007ffc`09394e0c c9030035 cbnz w9, shcore!SHStrDupW+0xa4 (00007ffc`09394e84) ; branch if w9 != 0 to advance x8 to the end of 'psz' string
00007ffc`09394e10 080113cb sub x8, x8, x19 ; x8 = x8 - x19; or x8 = length of 'psz' in bytes
00007ffc`09394e14 08fd4193 asr x8, x8, #1 ; x8 = (int64_t)x8 >> 1; or divide-by-2
00007ffc`09394e18 16050011 add w22, w8, #1 ; w22 = w8 + 1; w22 and w8 being lower 32 bits of x22 and x8
00007ffc`09394e1c c07a7fd3 ubfiz x0, x22, #1, #0x1F ; x0 = (x22 & ((1ULL << 31) - 1)) << 1; or roughly: x0 = x22 * 2 - this is the 1st input argument, or memory size, for CoTaskMemAlloc
00007ffc`09394e20 09250194 bl shcore!CoTaskMemAlloc (00007ffc`093de244) ; call CoTaskMemAlloc00007ffc`09394e24 f50300aa mov x21, x0 ; x21 = x0 = return value from CoTaskMemAlloc, or allocated memory pointer
00007ffc`09394e28 750100b4 cbz x21, shcore!SHStrDupW+0x74 (00007ffc`09394e54) ; branch to error if x21 is NULL, or if allocation failed
00007ffc`09394e2c c27a7fd3 ubfiz x2, x22, #1, #0x1F ; x2 = (x22 & ((1ULL << 31) - 1)) << 1; or roughly: x2 = x22 * 2 - this is the 3rd argument, or memory size, for memcpy
00007ffc`09394e30 e10313aa mov x1, x19 ; x1 = x19 = 2nd argument for memcpy, or source buffer
00007ffc`09394e34 c72c0294 bl shcore!#memcpy (00007ffc`09420150) ; call memcpy, with 1st argument being return value from CoTaskMemAlloc
00007ffc`09394e38 950200f9 str x21, [x20] ; *x20 = x21; or *ppwsz = allocated buffer pointer
00007ffc`09394e3c 00008052 mov w0, #0 ; return code: 0 = S_OK
00007ffc`09394e40 fd7bc1a8 ldp fp, lr, [sp], #0x10 ; function epilog, restore: fp, lr, x21, x22, x19, x20 from the stack
00007ffc`09394e44 f55b41a9 ldp x21, x22, [sp, #0x10]
00007ffc`09394e48 f353c2a8 ldp x19, x20, [sp], #0x20
00007ffc`09394e4c ff2303d5 autibsp ; authenticate return address back to LR
00007ffc`09394e50 c0035fd6 ret ; return from the function00007ffc`09394e54 e0010018 ldr w0, shcore!SHStrDupW+0xb0 (00007ffc`09394e90) ; w0 = 8007000e - return error code E_OUTOFMEMORY
00007ffc`09394e58 fd7bc1a8 ldp fp, lr, [sp], #0x10 ; function epilog, restore: fp, lr, x21, x22, x19, x20 from the stack
00007ffc`09394e5c f55b41a9 ldp x21, x22, [sp, #0x10]
00007ffc`09394e60 f353c2a8 ldp x19, x20, [sp], #0x20
00007ffc`09394e64 ff2303d5 autibsp ; authenticate return address back to LR
00007ffc`09394e68 c0035fd6 ret ; return from the function00007ffc`09394e6c 40010018 ldr w0, shcore!SHStrDupW+0xb4 (00007ffc`09394e94) ; w0 = 80070057 - return error code E_INVALIDARG
00007ffc`09394e70 fd7bc1a8 ldp fp, lr, [sp], #0x10 ; function epilog, restore: fp, lr, x21, x22, x19, x20 from the stack
00007ffc`09394e74 f55b41a9 ldp x21, x22, [sp, #0x10]
00007ffc`09394e78 f353c2a8 ldp x19, x20, [sp], #0x20
00007ffc`09394e7c ff2303d5 autibsp ; authenticate return address back to LR
00007ffc`09394e80 c0035fd6 ret ; return from the function ; loop that counts length of 'psz' string in bytes
00007ffc`09394e84 092dc078 ldrsh w9, [x8, #2]! ; x8 += 2; w9 = (int32_t)*((int16_t*)x8)
00007ffc`09394e88 e9ffff35 cbnz w9, shcore!SHStrDupW+0xa4 (00007ffc`09394e84) ; continue looping if w9 != 0
00007ffc`09394e8c e1ffff17 b shcore!SHStrDupW+0x30 (00007ffc`09394e10) ; branch back
00007ffc`09394e90 0e000780 ??? ; value 8007000e = E_OUTOFMEMORY
00007ffc`09394e94 57000780 ??? ; value 80070057 = E_INVALIDARGI need to point out a few things first:
In case you are struggling to figure out the destination for each branch (in theb,cbzorcbnzinstructions), it is specified in the parentheses on the right. For instance, the destination address for this branch: is the instruction at the address00007ffc`09394e10, that you can see in the column on the left:
Additionally, as a tip, you can convert the contents of the 00007ffc`09394e90 and 00007ffc`09394e94 addresses (that were used in the assembly code above) using the dd command:
0:006> dd 7ffc09394e94 L1
00007ffc`09394e94  80070057
0:006> dd 7ffc09394e90 L1
00007ffc`09394e90  8007000e
These two commands simply read two 32-bit DWORDs from the required addresses. Btw, those values are two HRESULT codes that the function returns in case of an error.
We can get error descriptions for those error codes using:
0:006> !error 80070057
Error code: (HRESULT) 0x80070057 (2147942487) - The parameter is incorrect.
0:006> !error 8007000e
Error code: (HRESULT) 0x8007000e (2147942414) - Not enough memory resources are available to complete this operation.
You can then convert these values to C preprocessor definitions using this handy site.
Finally, let me rewrite that function as C code that you can use to verify your own work:
#include "shlwapi.h"
#pragma comment(lib, "shlwapi.lib")


HRESULT SHStrDupW(__in LPCWSTR psz, __out LPWSTR  *ppwsz)
{
    *ppwsz = NULL;

    if(!psz)
    {
        return E_INVALIDARG;
    }

    size_t cb = (wcslen(psz) + 1) * sizeof(WCHAR);

    LPVOID pMem = CoTaskMemAlloc(cb);
    if(!pMem)
    {
        return E_OUTOFMEMORY;
    }

    memcpy(pMem, psz, cb);

    *ppwsz = (LPWSTR)pMem;

    return S_OK;
}
Now we can answer the original questions that I posed in the beginning.
Memory Leak In Calling The SHStrDupW Function
As we can see from its decompiled C code, the SHStrDupW function does not free the memory that was passed into it in the second argument. It merely zeroes it out and later overwrites it with a newly allocated pointer.
Having seen that, the original code sample that prompted this research should have been rewritten into something like this to avoid a memory leak:
LPWSTR pwsz = NULL;

SHStrDupW(L"Hello", &pwsz);
CoTaskMemFree(pwsz);             // Make sure to free this memory first before reusing this variable!

SHStrDupW(L"world", &pwsz);
CoTaskMemFree(pwsz);
Having reverse engineered the SHStrDupW function, now the answer becomes crystal clear, doesn't it?
Conclusion
A little bit of reverse engineering can go a long way to help you understand how some functions work under the hood. This can also help you fill in the gaps in the official documentation that is unclear or missing.